-
Welcome to the real Jehovah's Witnesses Online Community!
Welcome to JWTalk! JWTalk.Net is the only online community for real, actual Jehovah's Witnesses - those who are active, loyal, publishers of God's Kingdom - where you can speak with brothers and sisters from all around the world on a wide variety of topics.
All Activity
- Past hour
- Today
-
article about developments in bloodless surgery https://eu.jacksonville.com/story/news/healthcare/2026/08/03/baptist-health-program-gives-patients-blood-transfusion-alternatives/89449810007/
-
 It's such a shame that Australia is so far away from me!!!😭 If the rumor is true: Watch out for the end of filming—when the final clapperboard falls—because that’s when the casting office for contestants will officially open! If that’s the case: since he’s not in his twenties, he’s already proven that he knows how to—and can—wait. So five more years or less—once you reach a certain age, I guess it doesn’t really matter anymore. If that’s the case: the character he plays must inspire him. If that’s the case: it’s truly beautiful to dedicate 7 or 8 years to Jehovah and Jesus in this way. In any case: I wholeheartedly wish him abundant blessings for this self-sacrifice. He is absolutely right to trust in the power of the Holy Spirit to see this vow through to the end. May Jehovah prepare a beautiful Esther for him—beautiful both inside and out!
 -
 I've heard a rumor that Bro "Jesus" is single and had to take a vow to not date for 5 years. I'd love comments on this. Also, I'd love to see Bro "Andrew" in a suit haha
-
 To me, it looks like Jesus is picking the 12, just from a different angle. There are more than 13 men in that scene. or it could be filmed and taken from ep 7 or ep 8.
 -
I had my Convention on the weekend. The Brother who plays The Apostle Andrew was there, and he gave SYMPOSIUM: Applying Lessons From Jesus’ Illustrations the... Wheat and Weeds (Matthew 13:24-30) talk. I was talking to him after and asked which ep they were up to, He said Ep 11. P.S. His parents are in my congregation. His father is my Group overseer.
- 617 replies
-
- 11
-

-

-

-

-

NWS/NWP territories help and suggestions
Matt S replied to Tortuga's topic in Computers, Tablets, Mobile Devices, & Apps
Yes, it's really great for foreign language. Have used Alba in the past, and found NWS much easier for publishers to use. They love it. For example, you might choose to use 3 buttons: At Home, Not Home, Doesn't speak [target language]. Similar to what @foghornsaid: Gray = Either At Home OR Not at Home twice OR doesn't speak the langugage. Either way, this house is complete. If the house does not speak the target language (for example, they moved out), pressing the "Doesn't Speak [target language]" button also turns the address grey. These are removed from the map once the map is completed and turned in, which makes the map more accurate for the next time it is checked out. Blue = Not yet worked Orange = Not Home once, still needs a [second] attempt. (You can set how many times each address should be tried before being considered "complete".) There can be notes on an address. For example "Flat at back of main house". Or "[Chinese] Speaking Spouse" telling the publisher if they meet an [English] speaking person, don't assume no one speaks [Chinese] in the household. If a house is called on and the householder says "My neighbour is [Chinese]." The publisher can add the address to the map via NWP including obtaining the location coordinates via NWP. Similarly if while working the area, the publisher identifies a house as having someone speaking [Chinese] which is not on the map, they can add it. The territory servant then checks the address and any notes later and approves it to be added to the map. Whereas the map @foghorn posted shows every house, a map for a foreign language congregation would only show the households that speak the target language. This also helps when covering the territory in idenfying who densely populated the area is for that language, whether the territory can be walked or whether car groups are better suited. The addresses change colour in real time, meaning publishers can visually tell where others are working, which areas are left to be done, etc. -
person 1: I wanna buy a singing group person 2: Dont you mean a choir? person 1: fine, i want to acquire a singing group edit:this joke works bettee verbally :<
-

NWS/NWP territories help and suggestions
Tortuga replied to Tortuga's topic in Computers, Tablets, Mobile Devices, & Apps
Thanks. I was assuming that all of that information reset back to default when the territory was returned. So then, when and how does the territory get reset back to normal? Edit: I found the Help file. I see how it works now. Thanks. -

NWS/NWP territories help and suggestions
foghorn replied to Tortuga's topic in Computers, Tablets, Mobile Devices, & Apps
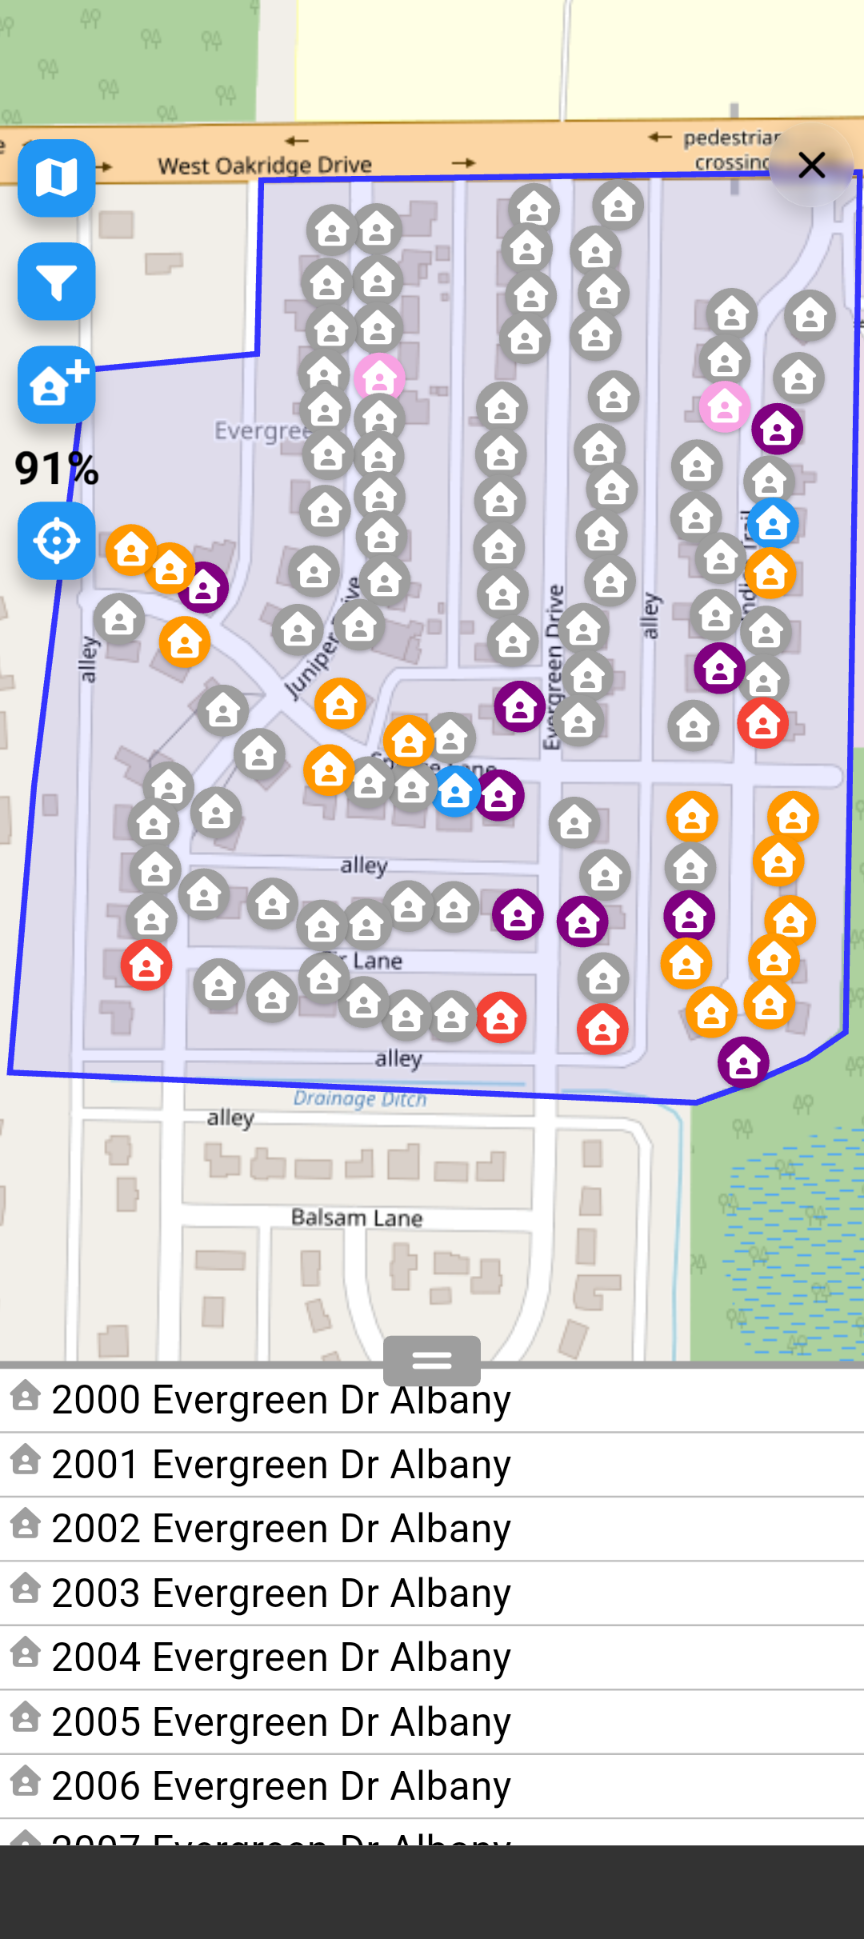
EXAMPLE OF PARTIALLY WORKED TERRITORY Gray = either AtHome or NotHome x2. Either way, this house is complete Blue = not yet worked at all Orange = Not Home x1 Pink = No Tresspassing Purple = vacant Red = Do Not Call
-
NWS/NWP territories help and suggestions
foghorn replied to Tortuga's topic in Computers, Tablets, Mobile Devices, & Apps
NOT HOME: We are set up to make two attempts at each address. So the not home field shows whether you have tried once or twice. If twice then the color of the The building turns Gray, indicating that no more attempts are required - that house is considered 'worked'. After the territory is returned, a letter writing territory is generated using only Addresses marked "not home" or "no trespassing" NO TRESSPASSING: This indicator remains turned on for that address. This changes the Color of the building on the map to indicate we should not go there. This stays with the territory after it is checked in. In addition, each time we work the territory we verify that it still has a no trespassing sign on the property. VACANT: This remains turned on for that address. This changes the color of the building just to indicate there's no need to work that property. Each time we work the territory we verify that it is still vacant. When we create letter writing territories, vacant houses are omitted so we don't waste time sending letters to them. -
 So I’m not sure what problem is being solved. Direction is that FSGO is consulted so how does this assist. Our congregation publishers typically submit an electronic application via email or message to service committee who consider and request input from FSGO. In my opinion this complicants the whole process. And contrary to what I’ve read no one is rubber stamped. What is really needed. I know there are NWS programmers on this site—could you ask what we need and not assume please. Could you stabilize the whole program before introducing stuff.
 -
NWS/NWP territories help and suggestions
Tortuga replied to Tortuga's topic in Computers, Tablets, Mobile Devices, & Apps
Thanks. What happens to that information when the territory is returned? How is that information used? -
NWS/NWP territories help and suggestions
foghorn replied to Tortuga's topic in Computers, Tablets, Mobile Devices, & Apps
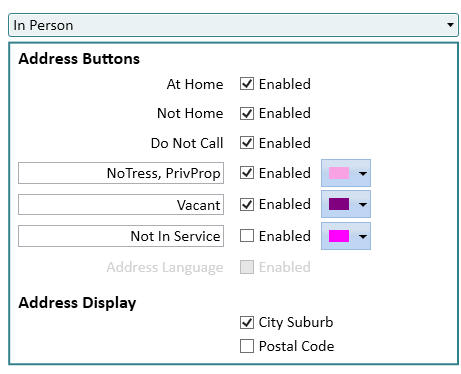
Our setup looks like this: (see img). We have many properties marked "No Trespassing" as well as many "Vacant" buildings. So we created buttons for those. The "Not In Service" button only shows on Telephone Territory.
-
It's a very good flick, award-worthy in several ways. I'm one who doesn't allow popular opinion to determine much, if any of what I do - especially not worldly opinions. 🙄😒 They don't need my permission or approval for anything and I certainly don't need theirs. Skip those scrubs.. And I REALLY don't indulge racial controversy. That mess is not my circus, not my monkeys. I went with a group of friends- predominantly White, but with a Mexican sister, Japanese sister, and half-Chinese brother. I'm biracial (Black/White) and we all had a blast. I'm so sorry you were affected like that, @Ostria 😔 Wakanda Forever
-
-
I was hoping that would be done automatically once the application was approved. Our Secretary doesn't usually select the AP box on the Publisher Record until the end of the month...😟
- Yesterday
-
NWS/NWP territories help and suggestions
Tortuga replied to Tortuga's topic in Computers, Tablets, Mobile Devices, & Apps
How does your congregation use the three custom fields for marking a home in the territory? We have At Home, Not At Home and DNC. What do you have? -
https://nwscheduler.com/how-to/nw-publisher-app-features-me/#Auxiliary_Pioneer
-
 Claude found some limited documentation regarding the process: NW Scheduler | NW Publisher app - Me View Scroll down to "Process Received Auxiliary Pioneer Applications" Over time, I have seen Claude and ChatGPT gain extensive knowledge of NWS. They many times can give answers even narrowing it down to a specific version of the software. Like everything else I do, I prefer Claude over all the othe AI platforms for most things. Me: New World Scheduler has added the ability for publishers to submit an Auxiliary Pioneer application. Is there any help/support documents from NWS yet that explains how this will be processed by the Congregation Service Committee? How will they approve an application in NWS? Here is Claude's response: What's confirmed in NWS help docs The core principle (unchanged from before, now digitized): The process is: A publisher submits an Auxiliary Pioneer Application through the NW Publisher app (under Me), rather than filling out a paper S-205b form. This request comes into NW Scheduler, where the Service Committee reviews it and decides to approve or deny it — same as the traditional paper-based process (referencing Organized p. 109). If approved, the Secretary is the one who acts on it in NWS — he ticks "AP" on that publisher's Field Service Report for the relevant month(s). This is what makes the Congregation Field Service Report (S-1) correctly reflect them as an Auxiliary Pioneer. If a publisher is set up as a Continuous Auxiliary Pioneer in Person Spiritual Information, NWS will auto-tick AP for future months without a fresh application each time. Where this lives in NWS The application itself is submitted from NW Publisher app → Me → Auxiliary Pioneer Application. Processing/approval isn't a separate "inbox" workflow like Territory or Hospitality Requests. The Service Committee makes its decision outside the software (in their normal meeting/discussion), and then the Secretary manually reflects that decision by ticking AP on the Publisher Record for that month, same as before the app feature existed. I could not find a page laying out a dedicated step-by-step "here's exactly how the Service Committee logs their approval/denial decision inside NWS" — the current docs mainly confirm that it routes through the Service Committee and what the Secretary does once approved, not a granular in-app approval workflow (e.g., no visible "Approve/Deny" button described yet, unlike Territory or Hospitality Requests).
 -
JW.ORG: 1125+ languages and growing!
jwhess replied to Raven's topic in Encouragement for the Worldwide Brotherhood
We are back up the 1127...Yay -
 Monday, August 3 There is going to be a resurrection of both the righteous and the unrighteous.—Acts 24:15. Ever since Adam and Eve joined Satan and rebelled against Jehovah God, billions of humans have died. What lies ahead for all those people? A limited number, 144,000 in all, of Christ’s faithful followers will receive a resurrection to immortal life in heaven. (Rev. 14:1) And a vast number of faithful men and women who loved Jehovah will be part of the “resurrection of . . . the righteous,” and they will live forever on earth if they remain righteous during Christ’s Millennial Reign and during the final test. (Dan. 12:13; Heb. 12:1) Also during the Millennium, “the unrighteous”—including those who never served Jehovah or who even “practiced vile things”—will be given an opportunity to change their ways and become faithful. (John 5:29; Luke 23:42, 43) However, some humans were so wicked that he has decided that there will be no resurrection for them at all.—Luke 12:4, 5. w24.05 2 ¶3; 5 ¶15; 6 ¶17
 -
 The approval can't / shouldn't be done in some cases without dialogue. You have ex pioneers who want to Aux Pioneer during a campaign. You have members of the servant body who want to Aux Pioneer those are all just rubber stamped applications like pushing the paper slip from one SC member to the next to initial it. But then you have applicants that require dialogue. Putting my coders hat on, if a servant wants to Aux pioneer the code could just look for the 3 SC members tasks and check are they completed. But it gets complicated when it is a first time or when someone who has applied in the past but missed the quota. The SC members would have to evaluate and answer the applications ability to fulfill this statement that he signed: "I have made plans that would enable me to meet the hour requirement" Main advantage I see is the chairman doesn't have to count and read Aux Pioneer slips and the secretary has the publishers marked as Aux Pioneers
 -

All the International convention Dates
Brandon replied to Brandon's topic in JW.org Press Releases & JW's in the News
All the convention dates, version 0.3 (thanks @ijsvogel) June 2026 Douala, Cameroon — June 19–21 Bucharest, Romania — June 19–21 Curitiba, Brazil — June 26–28 July 2026 St. John’s, Canada — July 3–5 Warsaw, Poland — July 3–5 Stockholm, Sweden — July 3–5 Kaohsiung, Taiwan — July 3–5 Porto, Portugal — July 10–12 Panama City, Panama — July 10–12 Calgary, Canada — July 31 – August 2 August 2026 Vilnius, Lithuania — August 7–9 Quito, Ecuador — August 7–9 Utrecht, Netherlands — August 14-16 Hamburg, Germany — August 14–16 Milwaukee, USA — August 28–30 Johannesburg, South Africa — August 28–30 November 2026 Manila, Philippines — November 6–8 San Diego, USA — November 27–29 December 2026 Bangkok, Thailand — December 11–13 -
 How would they complete the task? Simply checking the box? In the past I'm pretty sure that just tells NWS that the task has been completed or attended to. But in the case of AP applications, completing that specific task could result in either the application being approved or not approved. How would NWS know which one was the result? That is my query. I realize that you may not have the answer @Tortuga, I'm just putting it out there for everyone.
 -
If my understanding based on comments here is correct, it seems it will be a pretty straightforward process. A publisher uses NWP to submit an application, each of the SC receives a Task in NWS, assuming they are using the latest update and check NWS frequently. Once they complete the NWS Task, the applicants Publisher Record in NWS is automatically updated to indicate the applicant is an AP for the month selected. That information can be printed in the NWS Reports and given to the MWM chairman. Can anyone confirm that is the process?


.thumb.gif.503be83d9b641351930371e757a10eb4.gif)
-
Who's Online 47 Members, 0 Anonymous, 433 Guests (See full list)
- carlos
- kvazar
- Friend of Peace
- Romain
- truce
- Mike047
- Tony
- Osprey
- cabo63
- Cruzer
- Snow
- AYMA
- nealbrooks
- People Connector
- Kolawole
- Luchela
- CChambliss
- Tia
- PavelR
- wpw
- AH173
- Trenton Smith
- lejkas
- Hubi
- jimc
- foghorn
- Akisjw
- nicolette
- Sallyforth
- James the Less
- ishimini
- franceml
- j.kiragu
- Foxes53
- RafiJW
- TJ86
- Dolce vita
- Tonis
- ren'z
- GeordieGirl
- Aleks
- Alikay
- JW417
- booboo
- alessandroadorna
- mikemac2
- countrykaren
-
Upcoming Events
-
Our picks
-
Post in 1975 End of World ?
jwhess posted a post in a topic,
Modern references to creative days:
*** w15 6/1 p. 5 How Science Affects Your Life ***
The Bible fixes no duration for the six creative “days.” Instead, it opens the door for modern scientists to study them and assign accurate time spans to them. We know that the creative “days” were much longer than 24-hour days.
*** g21 No. 3 p. 12 What the Bible Tells Us ***
So each of the six creative “days” during which God prepared the earth for life and created life on it could represent extremely long periods of time.
*** g 1/14 p. 12 Creation ***
WHAT THE BIBLE SAYS God created the universe, including the earth, in the indefinite past—“in the beginning,” as Genesis 1:1 says. Modern science agrees that the universe had a beginning. A recent scientific model suggests it to be almost 14 billion years old.
*** lc pp. 26 Science and the Genesis Account ***
A careful consideration of the Genesis account reveals that events starting during one “day” continued into one or more of the following “days.”
Picked By
trottigy, -
-
-
Recent Public Status Updates
-

-

-
 "You can't teach a person to swim while they're drowning."· 3 replies
I feel like this is very applicable to our ministry, I just haven't thought it through yet. 🤔
Feel free to chime in!
-
-
 Bro Chew, can you be so kind to provide me with the transcript for the Video- Eager to Declare the Good news-Be ready with the right equipment- Excerpt? Would appreciate it so very much. Thanks.· 1 reply
-

-

-
 For anyone wondering what type of content I post I do Funny and relatable jokes, encouraging text, historical Bible proof, and Questions that we might all have.· 0 replies
-
-
-
-
Albums
-
👀
- By Line,
- 0
- 0
- 1
-
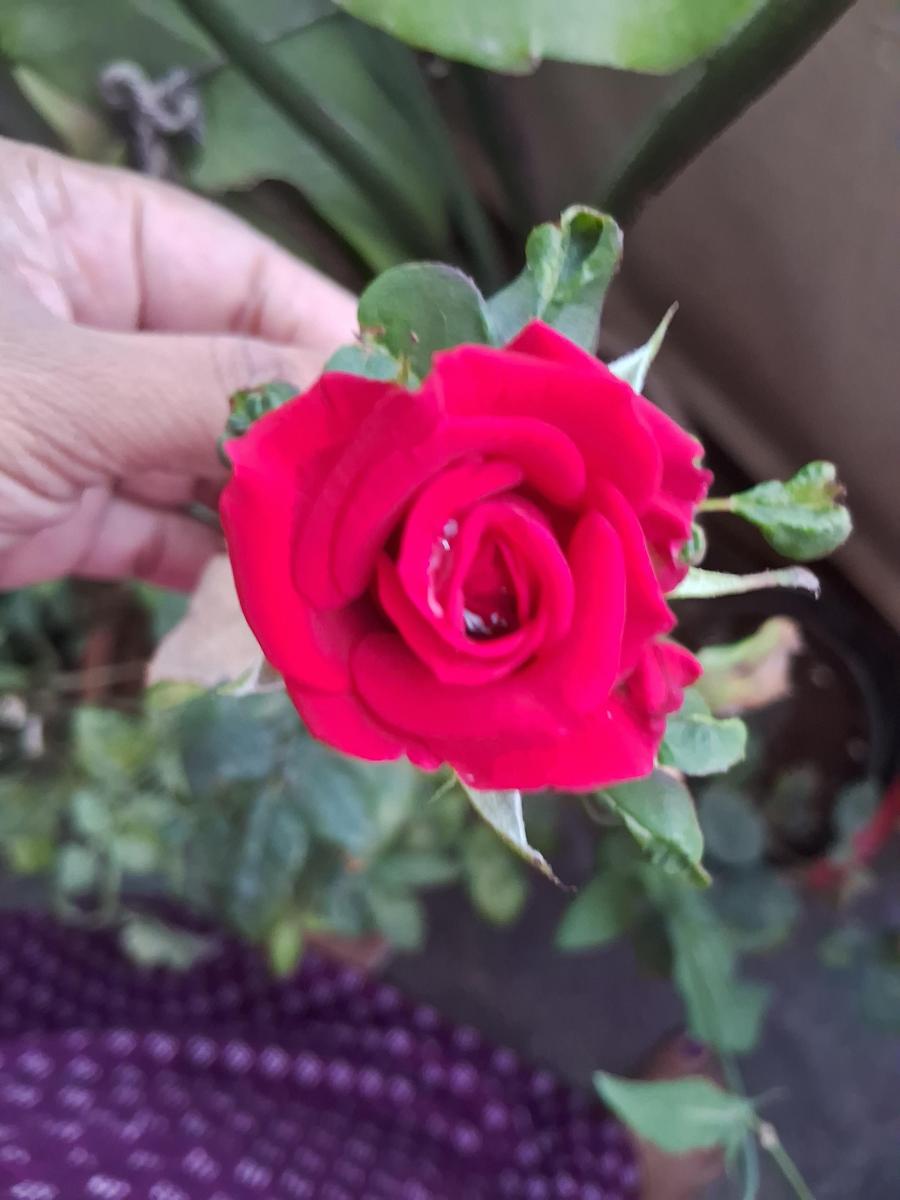
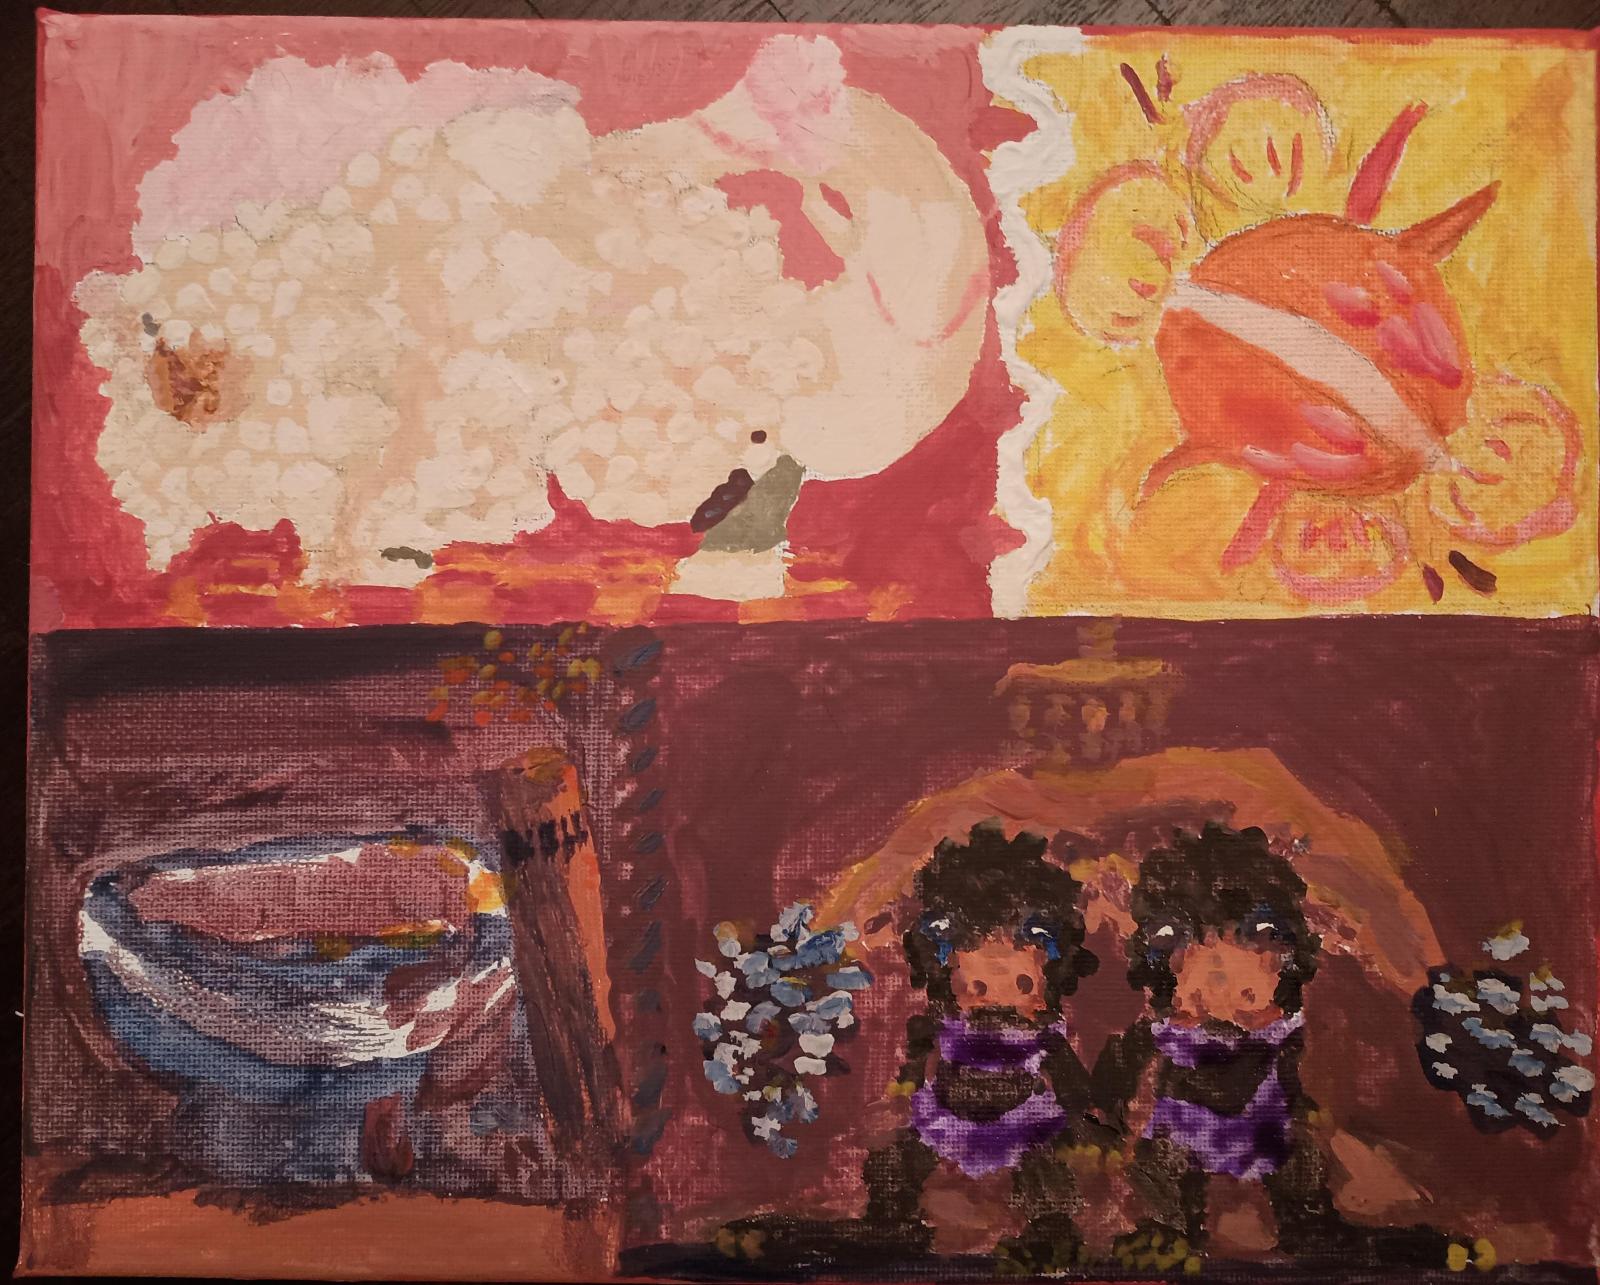
mysore ( India)
- By Jess j,
- 0
- 0
- 5
-

Scriptural consideration
- By DLJBSP,
- 0
- 1
- 3
-

Giants - Glimpses of Wonder Blog on JWtalk.net
- By DLJBSP,
- 2
- 0
- 60
-

Golden Beetle - Glimpses of Wonder Blog on JWtalk.net
- By DLJBSP,
- 0
- 0
- 4
-

About JWTalk.net - Jehovah's Witnesses Online Community
Since 2006, JWTalk has proved to be a well-moderated online community for real Jehovah's Witnesses on the web. However, our community is not an official website of Jehovah's Witnesses. It is not endorsed, sponsored, or maintained by any legal entity used by Jehovah's Witnesses. We are a pro-JW community maintained by brothers and sisters around the world. We expect all community members to be active publishers in their congregations, therefore, please do not apply for membership if you are not currently one of Jehovah's Witnesses.